Color Field Test Charts Vs HVFA In Detection Visual Field Defect Chronic Primary Glaucoma

Article Sidebar
- Visual field defect, HVFA SITA 10-2, Color field test charts
Abstract
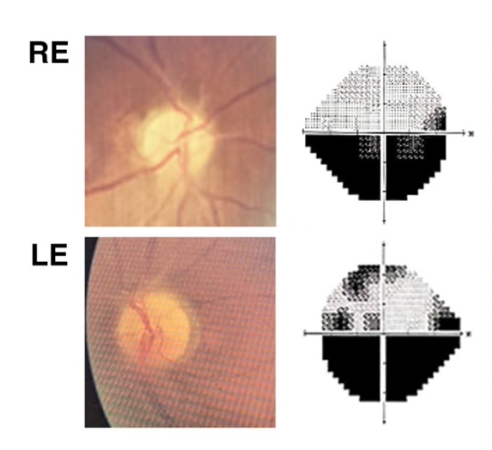
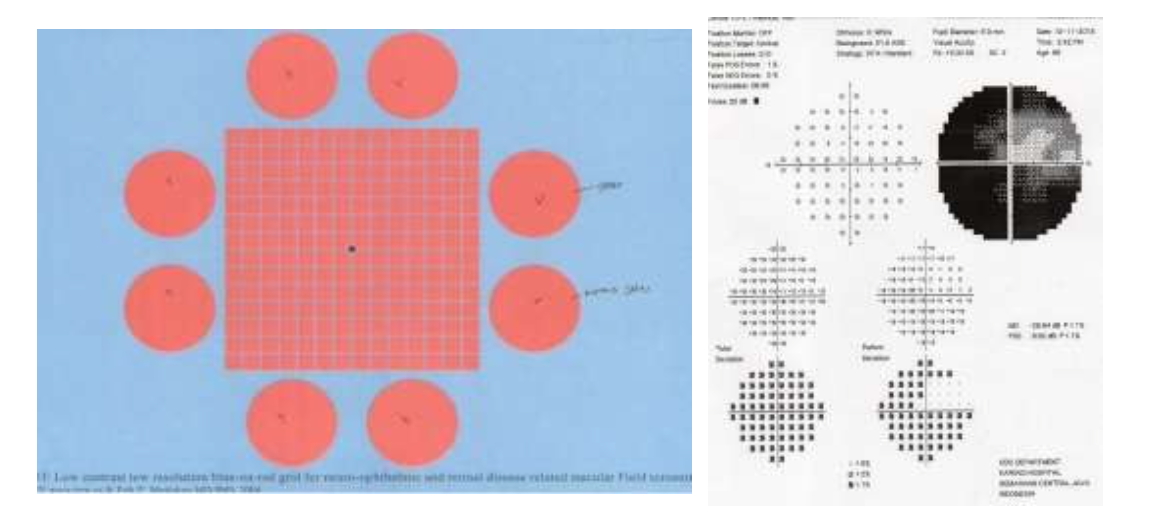
Introduction: Glaucoma is syndrome consist of glaucomatous optic neuropathy, destruction of retinal nerve fiber layer, and typical visual field defects. Color field test charts (CFTC) is a simple and generous instrument used to detect central and paracentral scotoma in neuro-ophthalmology patient. Diagnostic study will perform in this research to compare visual field defects, detecting in chronic primary glaucoma patient between CFTC and HVFA SITA 10-2 as gold standard.
Methods: Seventy two eyes from 50 patients with chronic primary glaucoma were examined visual acuity, funduscopy, color blindness, HVFA SITA 10-2 and CFTC. The results CFTC and HVFA were read by 2 ophthalmologists, and kappa agreement was done. Analysis was done to get sensitivity, specificity, positive predictive value (PPV), negative predictive value (NPV), accuracy, positive and negative likelihood ratio (LR).
Result: The sensitivity of CFTC was 87.93%, specificity 85.71%, PPV 96.22%, NPV 63.16%, accuracy 87.5%, positive LR 6.15 and negative LR 0.14 in detecting visual field defect chronic primary glaucoma patient compared to HVFA SITA 10-2. Area Under Curve (AUC) in this research was 0.86 (95% CI 0.751-0.985, p<0.001). Sensitivity, PPV, and accuracy was higher in MD >-12dB compared to <-12dB. There was strong correlation between it in location of defect (Cramer’s correlation; V=0.679, p<0.001), although the large of visual field defect was significantly different between 2 instruments (p<0.05).
Conclusion: Color field test charts is comparable to HVFA SITA 10-2 in detecting visual field defect chronic primary glaucoma moderate and advance stage.
Full text article
References
TJ Liessegang GS, LB Cantor. Basic and clinical science course. Glaucoma. San Fransisco: AAO; 2014.p. 68-71, 92-6.
Tham YC, Li X, Quigley H, Aung T. Global prevalence of glaucoma and projections of glaucoma burden through 2040: a systematic review and meta-analysis. American Journal of Ophthalmology. 2014;121:2081-90.
Kementrian Kesehatan Republik Indonesia. Gangguan penglihatan masih menjadi masalah kesehatan. Available from : http://www.depkes.go.id/article/print/845/gangg uan penglihatan-masih-menjadi- masalah- kesehatan.html
Kementrian Kesehatan Republik Indonesia. Situasi dan analisis glaukoma : Pusat data dan informasi. Available from :http://www.depkes.go.id/article/view/15031900 002/situasi-dan analisis-glaukoma.html
Rencana strategis kementrian kesehatan tahun 2015-2019. Kementrian Kesehatan Republik Indonesia. 2015. p. 5-15.
Cullen JF. The pale optic disc : some observations of a european neuro- ophthalmologist in southeast asia. Asian Journal of Ophthalmology. Vol 2(3). 2000.
Mutlukan E, Cullen JF. Red colour comparison perimetry charts field test charts neuropthalmological examination. Eye (1991) 5, 352-361. Available from : https://www.nature.com/articles/eye199157.pdf?origin=publication_detail
Murdoch I, Jones BR, Babalola OE, Cousens SN, Bolarin I, Abiose A. Red-dot charts test of the paracentral field as a screening test for optic nerve diasease in onchocerciasis. Bulletin of the World Health Organization. 1996. 74(6):573-6.
Kapetanakis VV, et al. Global variations and time trends in the prevalence of primary open angle glaucoma (POAG): a systematic review and meta-analysis. August18 th 2015. Available from : http://bjo.bmj.com/content/bjophthalmol/early/2 015/08/18 /bjophthalmol-2015-307223.full.pdf
Ramakrishnan R, Krishnadas SR, Khurana M, Robin AL. Diagnosis & management of Glaucoma. Bangladesh : Jaypee Brothers Medical Publishers. 2013. P 189
Chan EW, et al. Glaucoma in asia : regional prevalence variations and future projections. Available from : http://bjo.bmj.com/content/early/2015/06/25/bjo phthalmol -2014-306102
Kim JH, Lee HS, Kim NR, Seong GJ, Kim Cy. Relationship between visual acuity and retinal structures measured by spectral domain optical coherence tomography in patients with open- angle glaucoma. Invest Ophthalmol Vis Sci. 2014;55:4801–4810
Tilaki KH. Receiver operating characteristic (ROC) curve analysis for medical diagnostic test evaluation. Caspian J Intern Med 2013; 4(2): 627-635
Trope GE, Britton. A comparison of golddmann and Humphrey automeated perimetry in patients with glaucoma. British Journal of Ophthalmology. 1987:71:489-93.
Suh W, Lee JM, Kee C. Depth and area of retinal nerve fiber layer damage and visual field correlation analysis. Korean J Ophthalmololgy. 2014; 28(4) : 323-29.
Kanamori A, Nakamura M, Escano MF, et al. Evaluation of the glaucomatous damage on retinal nerve
fiber layer thickness measured by optical coherence tomography. Am J Ophthalmol 2003;135:513-20.
Jonas J, Fernandez MC, Sturmer J. Pattern of glaucomatous neuroretinal rim loss. Ophthalmology. 1993 Jan;100(1):63-70.
Gessesse GW, Damji KF. Advance glaucoma: managements pearls. Middle East Afr J Ophthalmol. 2013 Apr-Jun; 20(2): 131–141.
Marôco, J. (2011). Análise Estatística com o SPSS Statistics (5a ed.). Corbett, Michael. 2001. Research Methods in Political Science, An Introduction Using MicroCase (Wadsworth).
Authors
Copyright (c) 2022 Ivana Tanoko, Winarto Winarto, Trilaksana Nugroho, Riski Prihatningtias, Fifin L Rahmi

This work is licensed under a Creative Commons Attribution-NonCommercial-ShareAlike 4.0 International License.